# Introduction to troubleshooting IPFS
From a high level, troubleshooting IPFS typically comes down to finding the root cause of a problem in one of the following operations:
- Retrieval - Retrieving data by CID from other peers in the network.
- Providing - Providing data to other peers in the network.
Retrieval and providing are complementary operations, as one cannot be done without the other. Hence, their failure modes are closely related, and can be attributed to the following causes:
- Content routing: providers for a CID cannot be found in the DHT or the IPNI.
- Network connectivity: connecting to a provider is not possible, either because the provider is offline, or because the provider is not reachable over the network.
This guide outlines techniques to troubleshoot and identify the root cause of common issues with retrieval and providing in the public IPFS Mainnet network.
For the purposes of this guide, we will use the following tools:
- IPFS Check (opens new window) - A browser-based debugging tool that can help you identify the root cause of a problem with retrieval.
- Kubo (opens new window) - A popular implementation of IPFS with a CLI that can be used to troubleshoot retrieval and providing from the terminal.
- Helia Identify tool (opens new window) - A browser-based tool to run libp2p identify (opens new window) with a given peer id, testing whether the peer is dialable from a browser.
- Public Delegated Routing Endpoint at
https://delegated-ipfs.dev/routing/v1- which can be used to find providers for a CID.
# Troubleshooting retrieval
In this section, you will learn to troubleshoot common issues with retrieval. For a more detailed overview of the retrieval process, see the lifecycle of data in IPFS.
# Troubleshooting retrieval from public recursive IPFS gateways
If you are troubleshooting retrieval from a public recursive IPFS gateway, keep in mind that the gateway is just another IPFS node and an additional point of failure that you commonly have no insight into. This means that it's harder to troubleshoot, because as a user you cannot determine whether the problem is with the gateway or the provider node.
We therefore recommended using Kubo or IPFS Check to troubleshoot retrieval, which give you direct insight into the retrievability of the data by CID from providers
# What causes failure to retrieve data by CID?
When failing to fetch the data for a given CID, there are main classes of errors that may be the reason for this:
- Content routing: providers for the CID cannot be found in the DHT or the IPNI:
- Because there are no providers for the CID.
- Because the providers aren't announcing the CID to the DHT or IPNI
- Because there are problems with the DHT (opens new window) or the IPNI (opens new window).
- Connectivity:
- The provider is offline or unreachable over the network due to NAT or firewall issues.
- The provider is not dialable from browsers:
- Because the provider doesn't have a public IP.
- Because the provider doesn't support browser transports like Secure WebSockets, WebTransport, or WebRTC.
In the next section, you will learn how to use the delegated routing endpoint to check for providers for a CID, and how to get a more detailed overview of the root cause with IPFS Check.
# Checking for providers with the Delegated Routing Endpoint
To get a quick overview of the providers for a given CID from both the DHT and the IPNI, you can use the Delegated Routing Endpoint at https://delegated-ipfs.dev/routing/v1, which you can query with a simple HTTP GET request.
For example, open delegated-ipfs.dev/routing/v1/providers/bafybeigdyrzt5sfp7udm7hu76uh7y26nf3efuylqabf3oclgtqy55fbzdi (opens new window) in your browser.
Or alternatively, use curl to query the endpoint:
curl -H "Accept: application/x-ndjson" "https://delegated-ipfs.dev/routing/v1/providers/bafybeigdyrzt5sfp7udm7hu76uh7y26nf3efuylqabf3oclgtqy55fbzdi"
Note: By setting the Accept header to
application/x-ndjson, the response will be streamed, so you don't need to wait for the entire response to be received before you can start processing the results.
If the response body contains be an array of providers with Peer IDs and Multiaddrs, and other information, as defined in the spec (opens new window), you can proceed to the next section to troubleshoot retrieval with IPFS Check.
If you get back a 404 with the response body {"Providers": null}, check out the section on No providers returned for more information.
# Troubleshooting retrieval with IPFS Check
IPFS Check (opens new window) is a web app that helps you troubleshoot retrieval by CID.
It helps you answer the following questions:
- How many providers for this CID could be found on IPFS Mainnet?
- In which routing system was each of those providers found, the Amino DHT or the IPNI?
- Is the data for the CID retrievable from the providers that are announcing it?
- Is the data for the CID retrievable over Bitswap and/or HTTP?
- What multiaddresses and network transports are used to connect to successful providers for a CID?
- Was NAT hole punching necessary to retrieve the data?
IPFS Check is comprised of a frontend interacting with a backend. The backend is a set of Go libraries that are used to query the DHT and IPNI, and to probe retrieval from the providers for a given CID. The frontend is a web app that allows you to interact with the backend and see the results.
# IPFS Check modes of operation
IPFS Check supports two modes of operation:
- Multi-provider check: you pass a CID and IPFS Check will search for providers both in the IPNI and the DHT, and return the retrievability results for multiple providers.
- Provider-specific check: you pass a CID and a provider's multiaddr or peer id, with
/p2p/prepended.
# Provider-specific checks with IPFS Check
- Navigate to the IPFS Check (opens new window) tool.
- In the CID field, enter the CID you are trying to check
- In the Multiaddr field, enter the multiaddress (either Peer ID or full multiaddr) of the IPFS peer you are trying to check.
- Click Run Test.
The Multiaddr field can be either:
- Just the Peer ID, with
/p2p/prepended, e.g./p2p/12D3KooWBgwLwbTX5YYgASx8sqv49WBhy9gzLCLFVCP9jshfVdC5. IPFS Check will route the Peer ID to find the full multiaddr. - The full multiaddr, e.g.
/ip4/1.1.1.1/tcp/4001/p2p/12D3KooWBgwLwbTX5YYgASx8sqv49WBhy9gzLCLFVCP9jshfVdC5.
For example, the output will look as follows, when doing a Peer ID specific check for a CID:
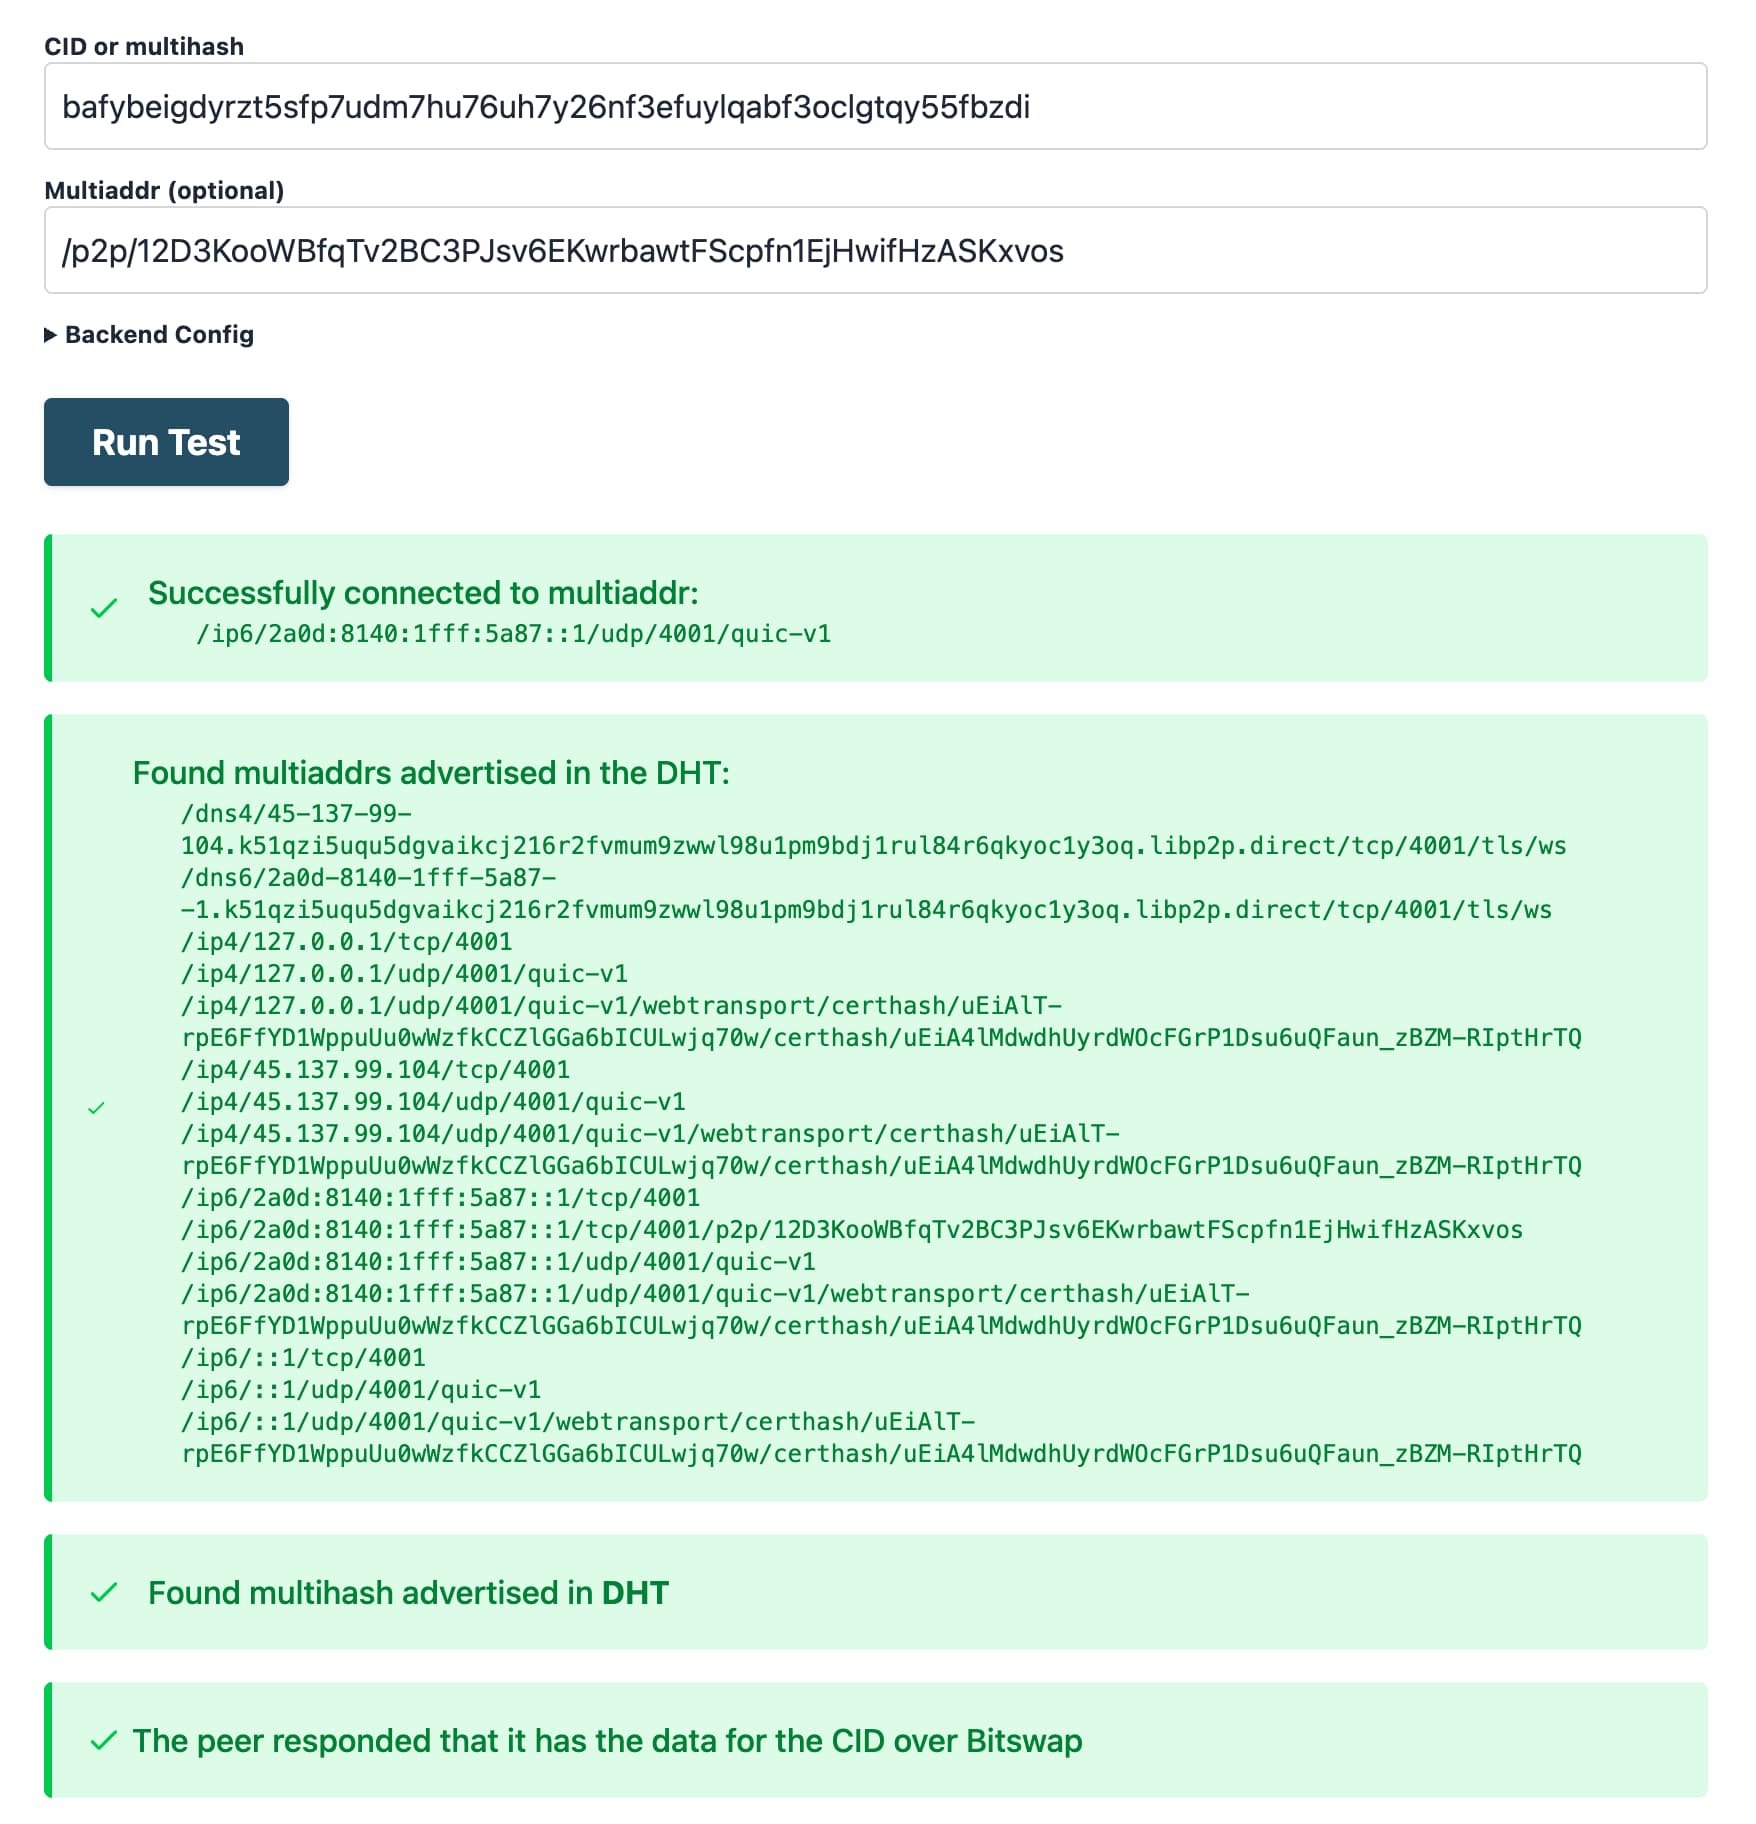
Looking at the output, you can know the following:
- The provider and the CID were routable via the DHT.
- The provider is online, and the data for the CID is retrievable over Bitswap.
- The provider was reachable over IPv6 with the QUIC transport, and also supports Secure WebSockets (the multiaddr with
dns4.../...libp2p.direct/tls/, ), WebTransport, - No NAT hole punching was necessary to retrieve the data, you can know this because there is a single connection multiaddr in the output, and it doesn't contain
p2p-circuit.
You can also test a specific multiaddr and transport combination, by entering the full multiaddr in the Multiaddr field. For example, this is what the output looks like when testing the Secure WebSockets multiaddr:
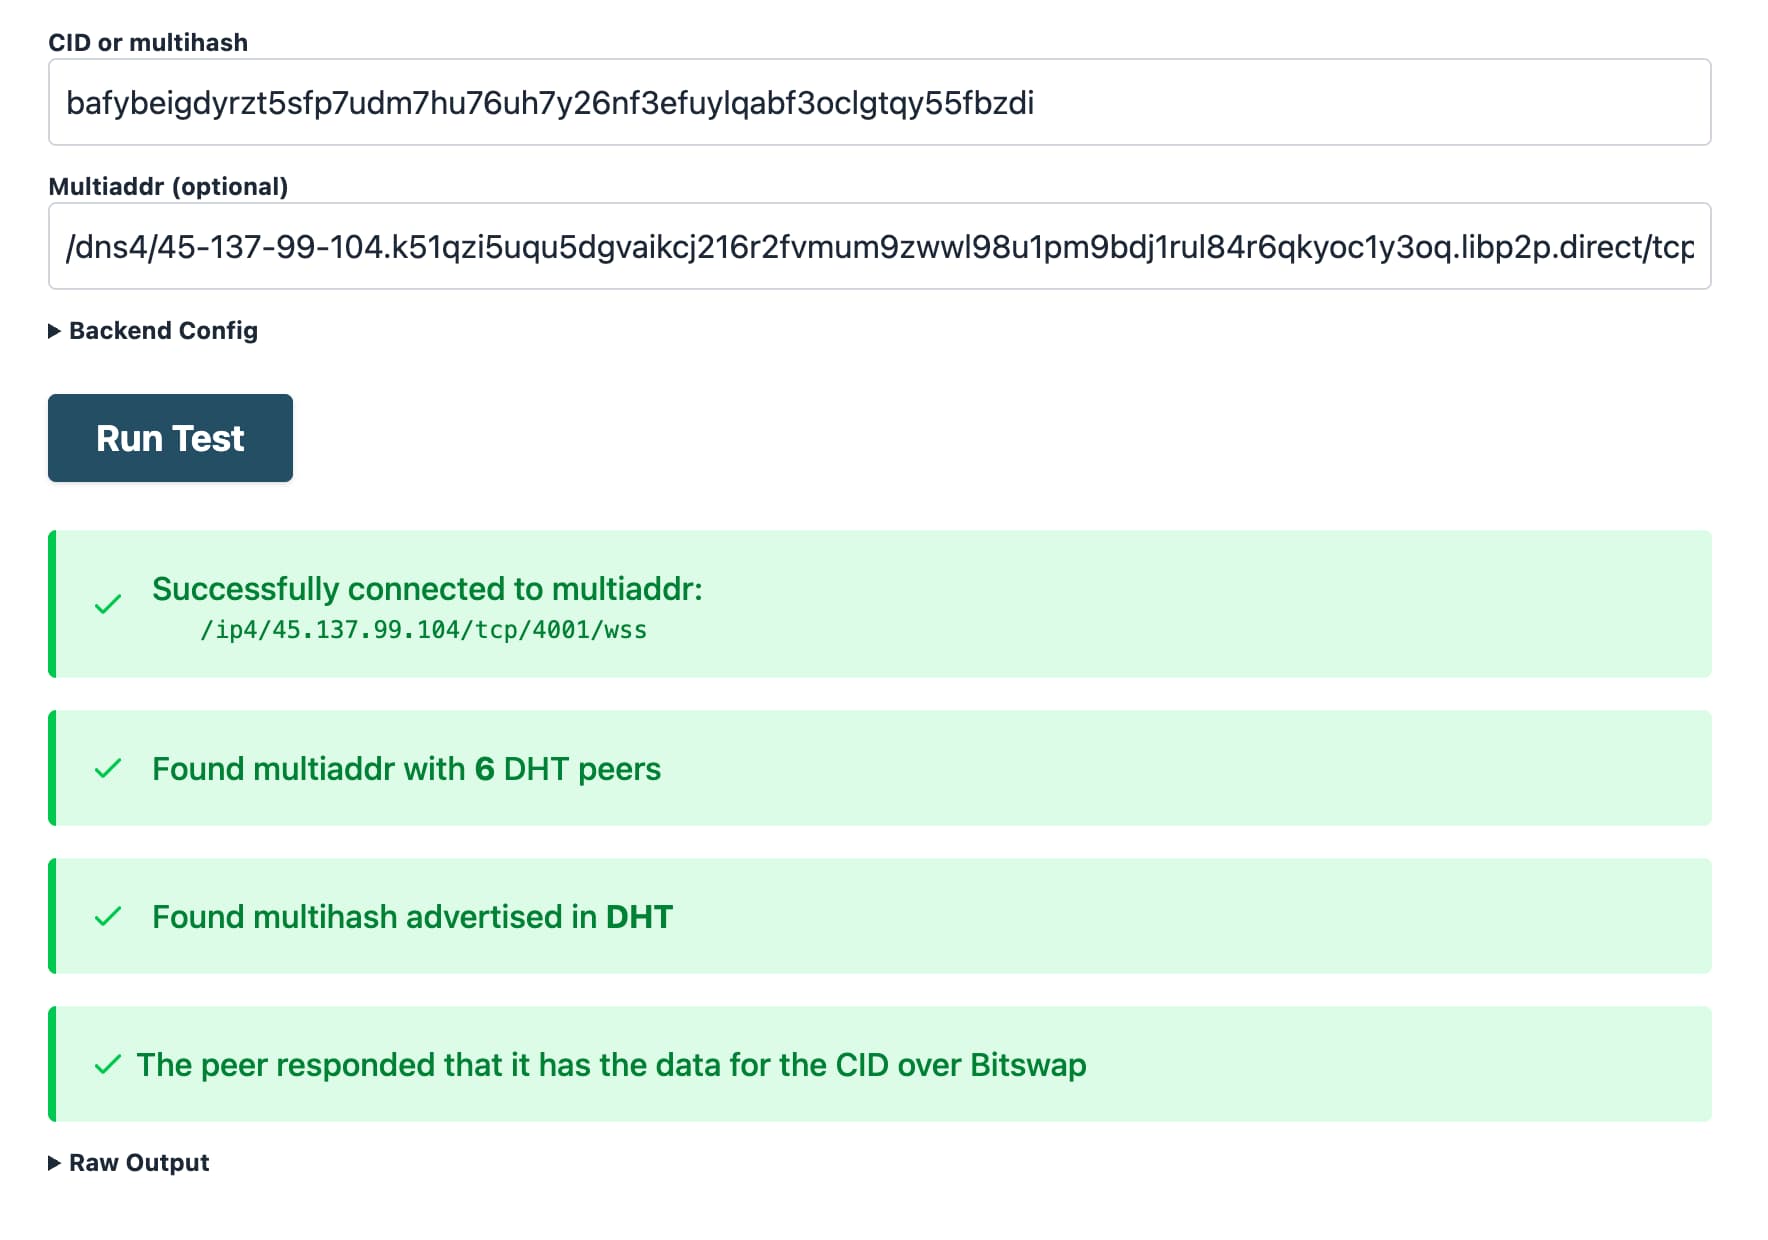
Since the Secure WebSockets multiaddr is also supported by all browsers, you can also test connectivity to the provider directly from a browser (rather than the IPFS Check backend like in this example) with the Helia Identify tool.
# Multi-provider checks with IPFS Check
In this mode, IPFS Check will search for providers both in the IPNI and the DHT, and return the retrievability results for multiple providers.
- Navigate to the IPFS Check (opens new window) tool.
- In the CID field, enter the CID you are trying to check
- Click Run Test.
The output will look as follows:
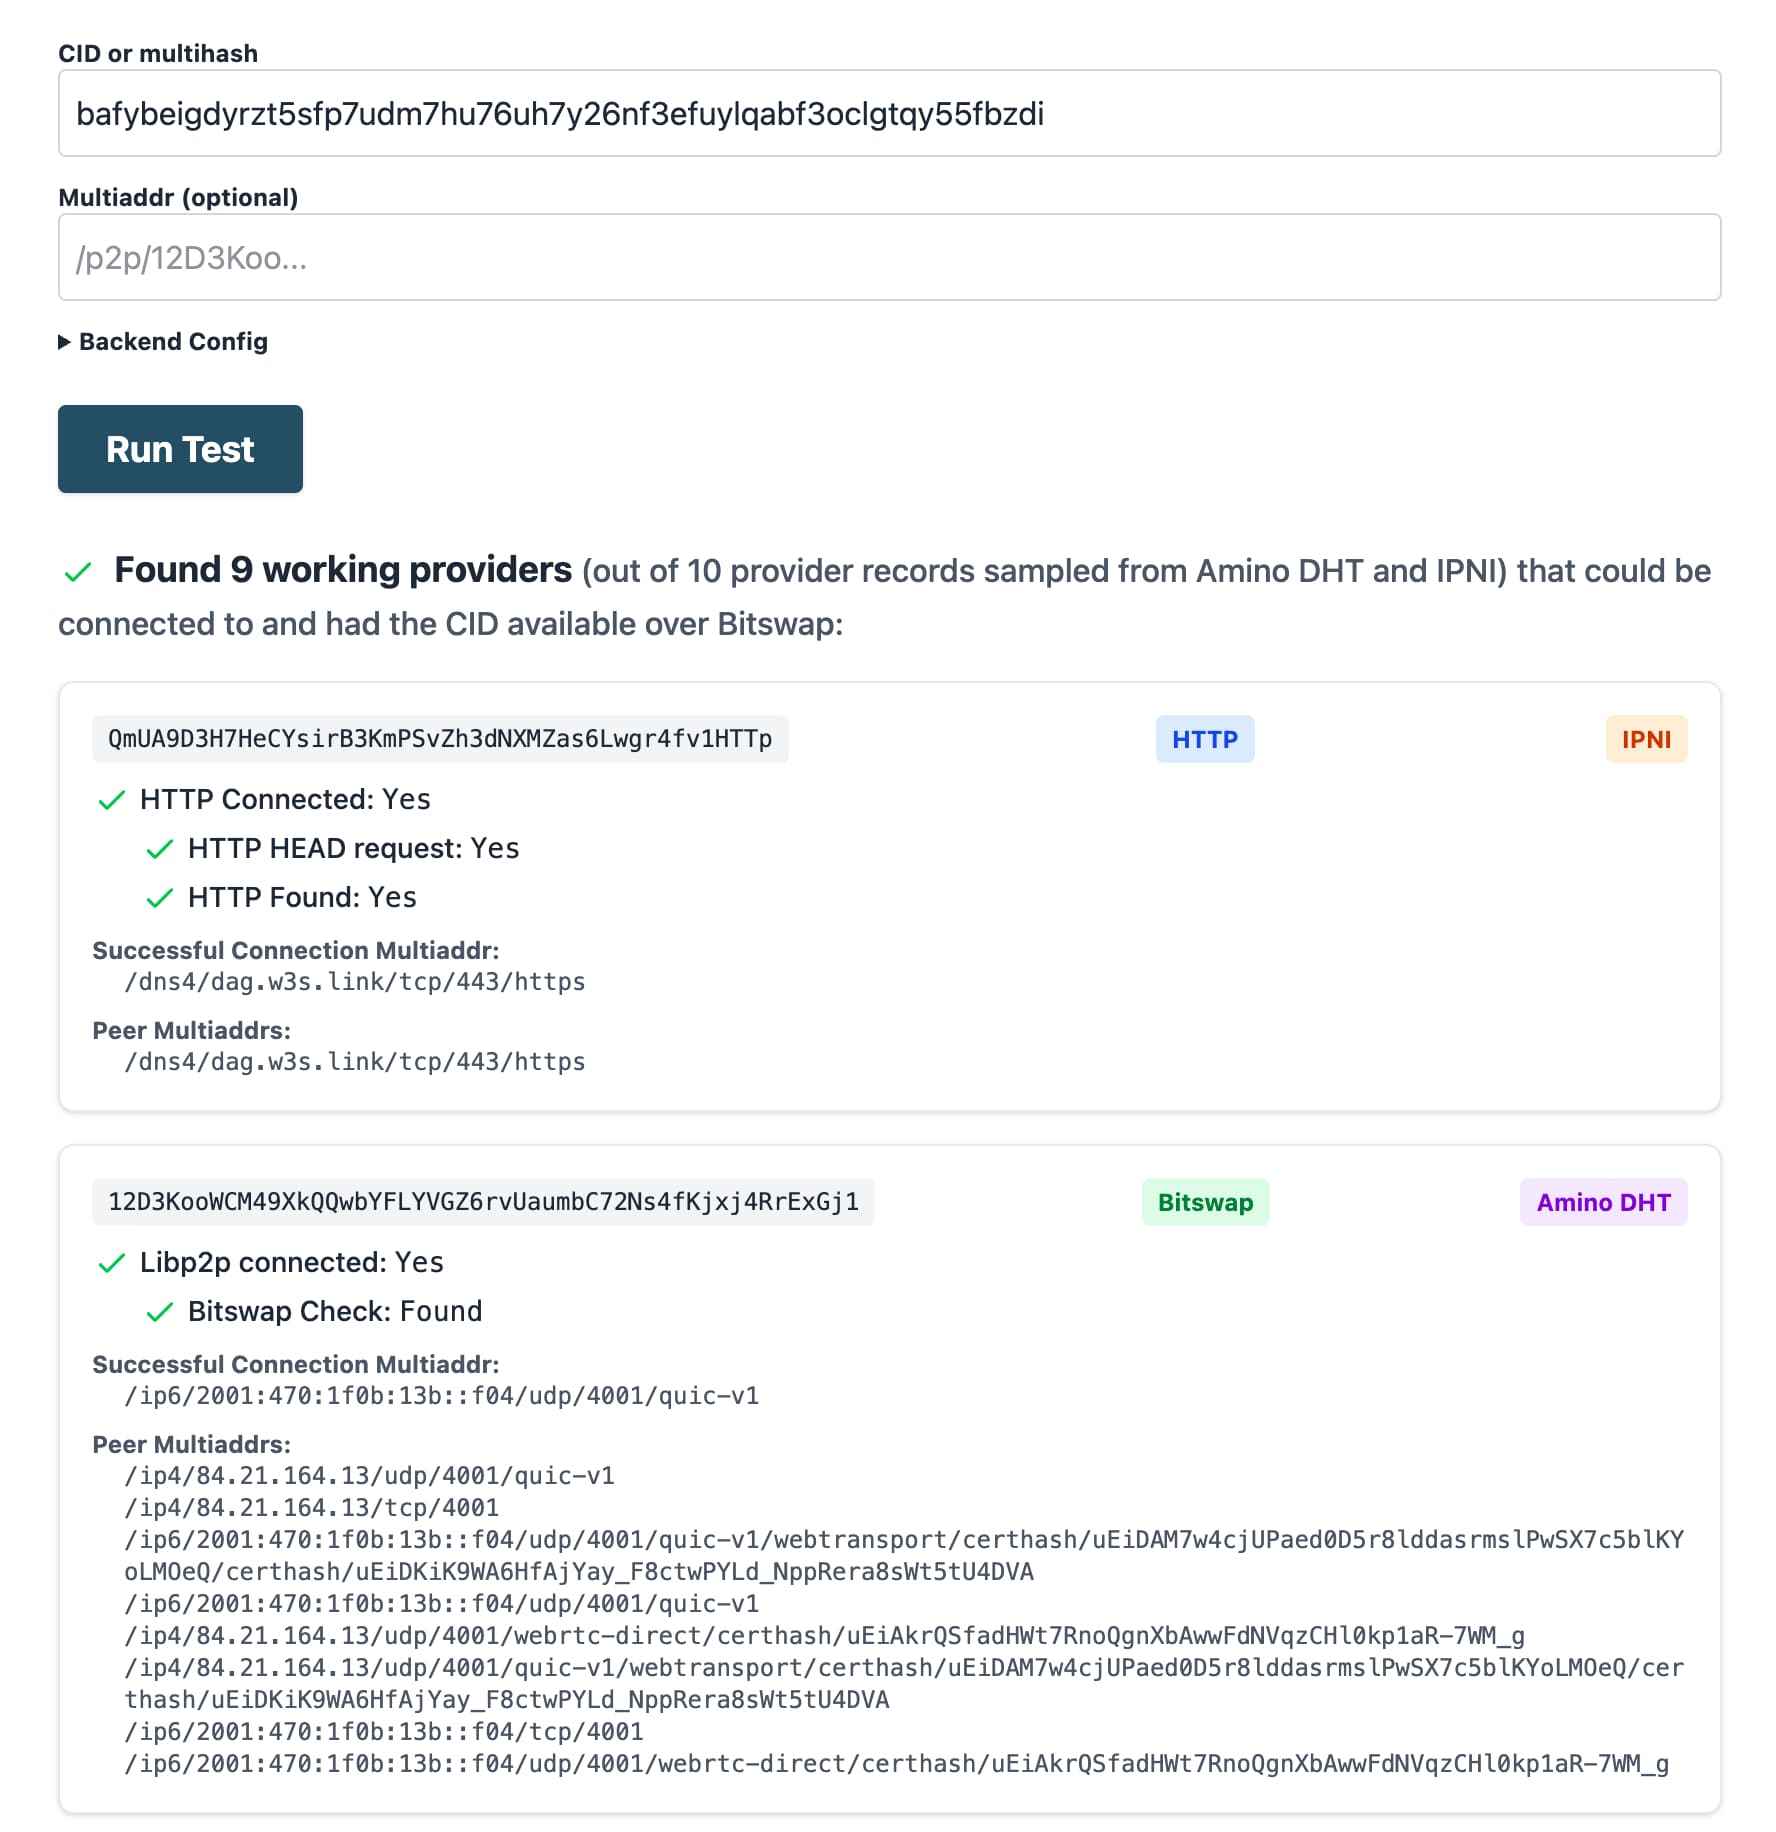
Looking at the output, you can know the following:
- The routing query found 9 working providers for the CID.
- Some providers were found in the IPNI, some in the DHT.
- Some providers are providing the data with HTTP (the first result), and others with Bitswap over a libp2p QUIC connection (the second result).
# Identifying NAT hole punching
When using IPFS Check, you can identify whether NAT hole punching was necessary to connect to a provider, by looking at the connection multiaddrs in the output. If there are two connection multiaddrs, and one of them contains p2p-circuit, for example:
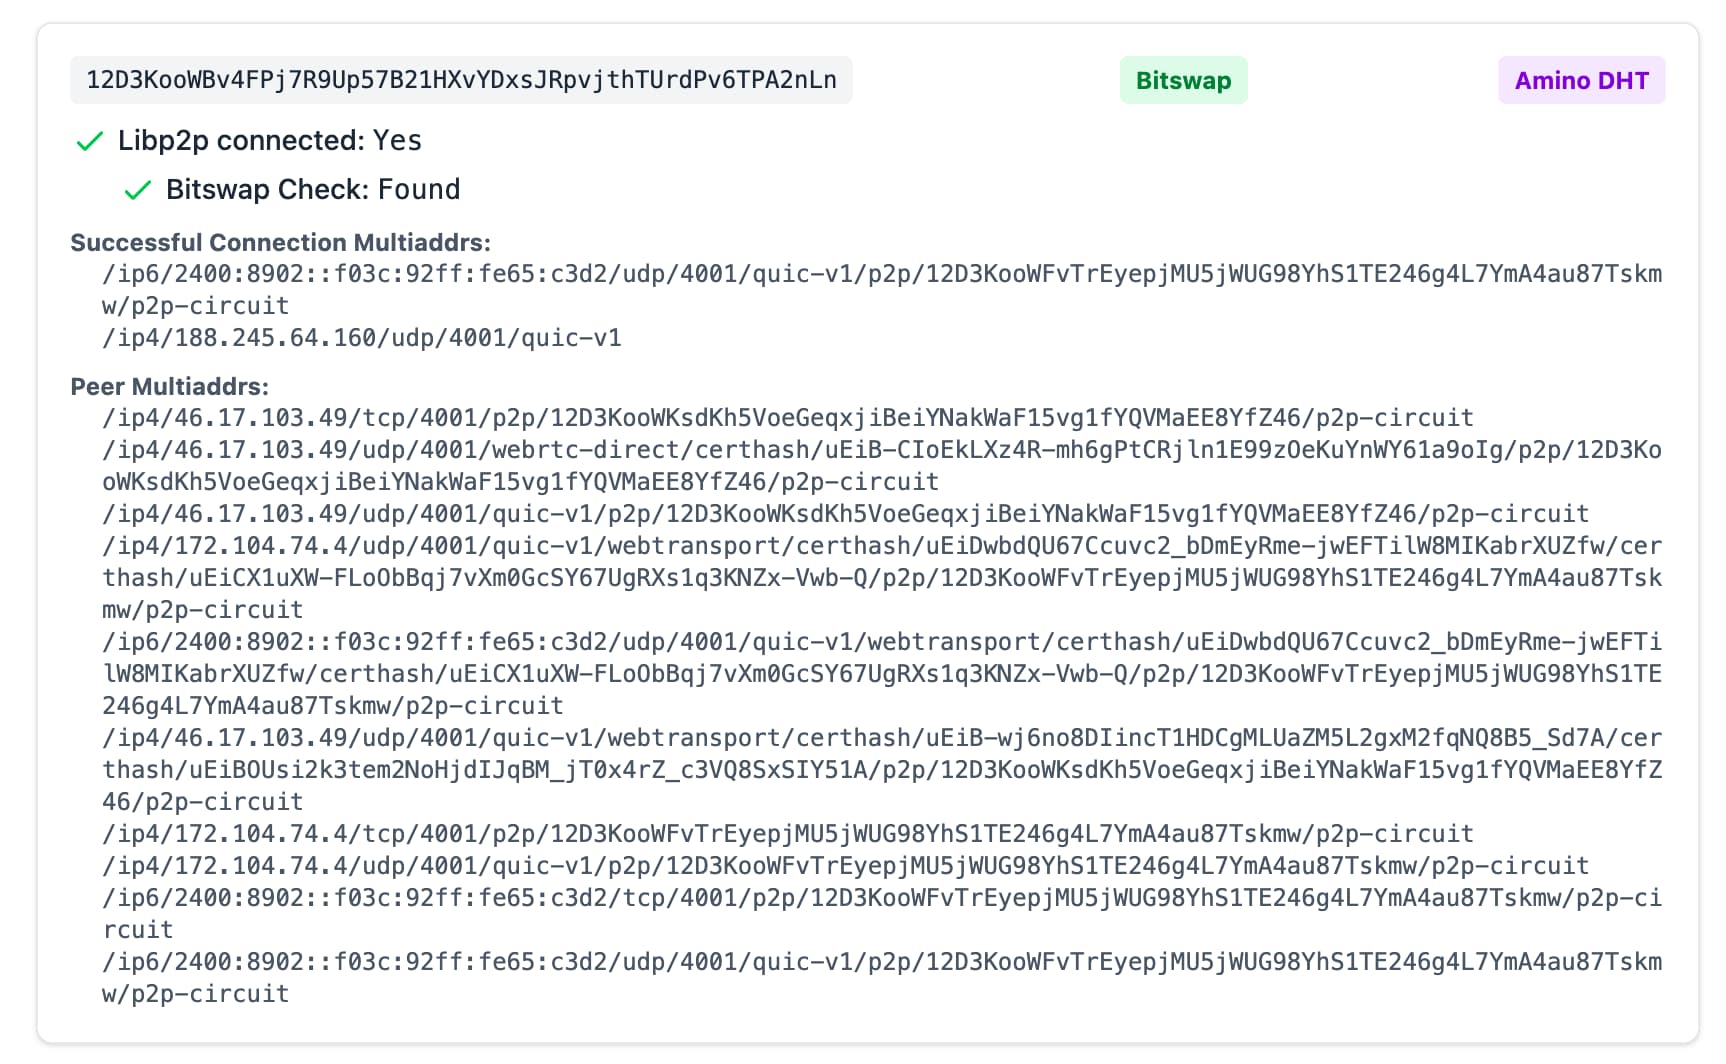
This is because when a provider peer is behind NAT, it will acquire a circuit relay reservation as part of the NAT hole punching process (DCUtR) (opens new window).
If NAT traversal is necessary to connect to a provider, and you are also behind NAT, there's a chance that NAT hole punching will fail for you. Unlike the IPFS Check backend which has a public IP (allowing DCUtR to leverage dialback for direct connection), when two peers are behind NAT, they cannot dial back to each other and require hole punching, which is not guaranteed to be successful.
# Debug browser connectivity
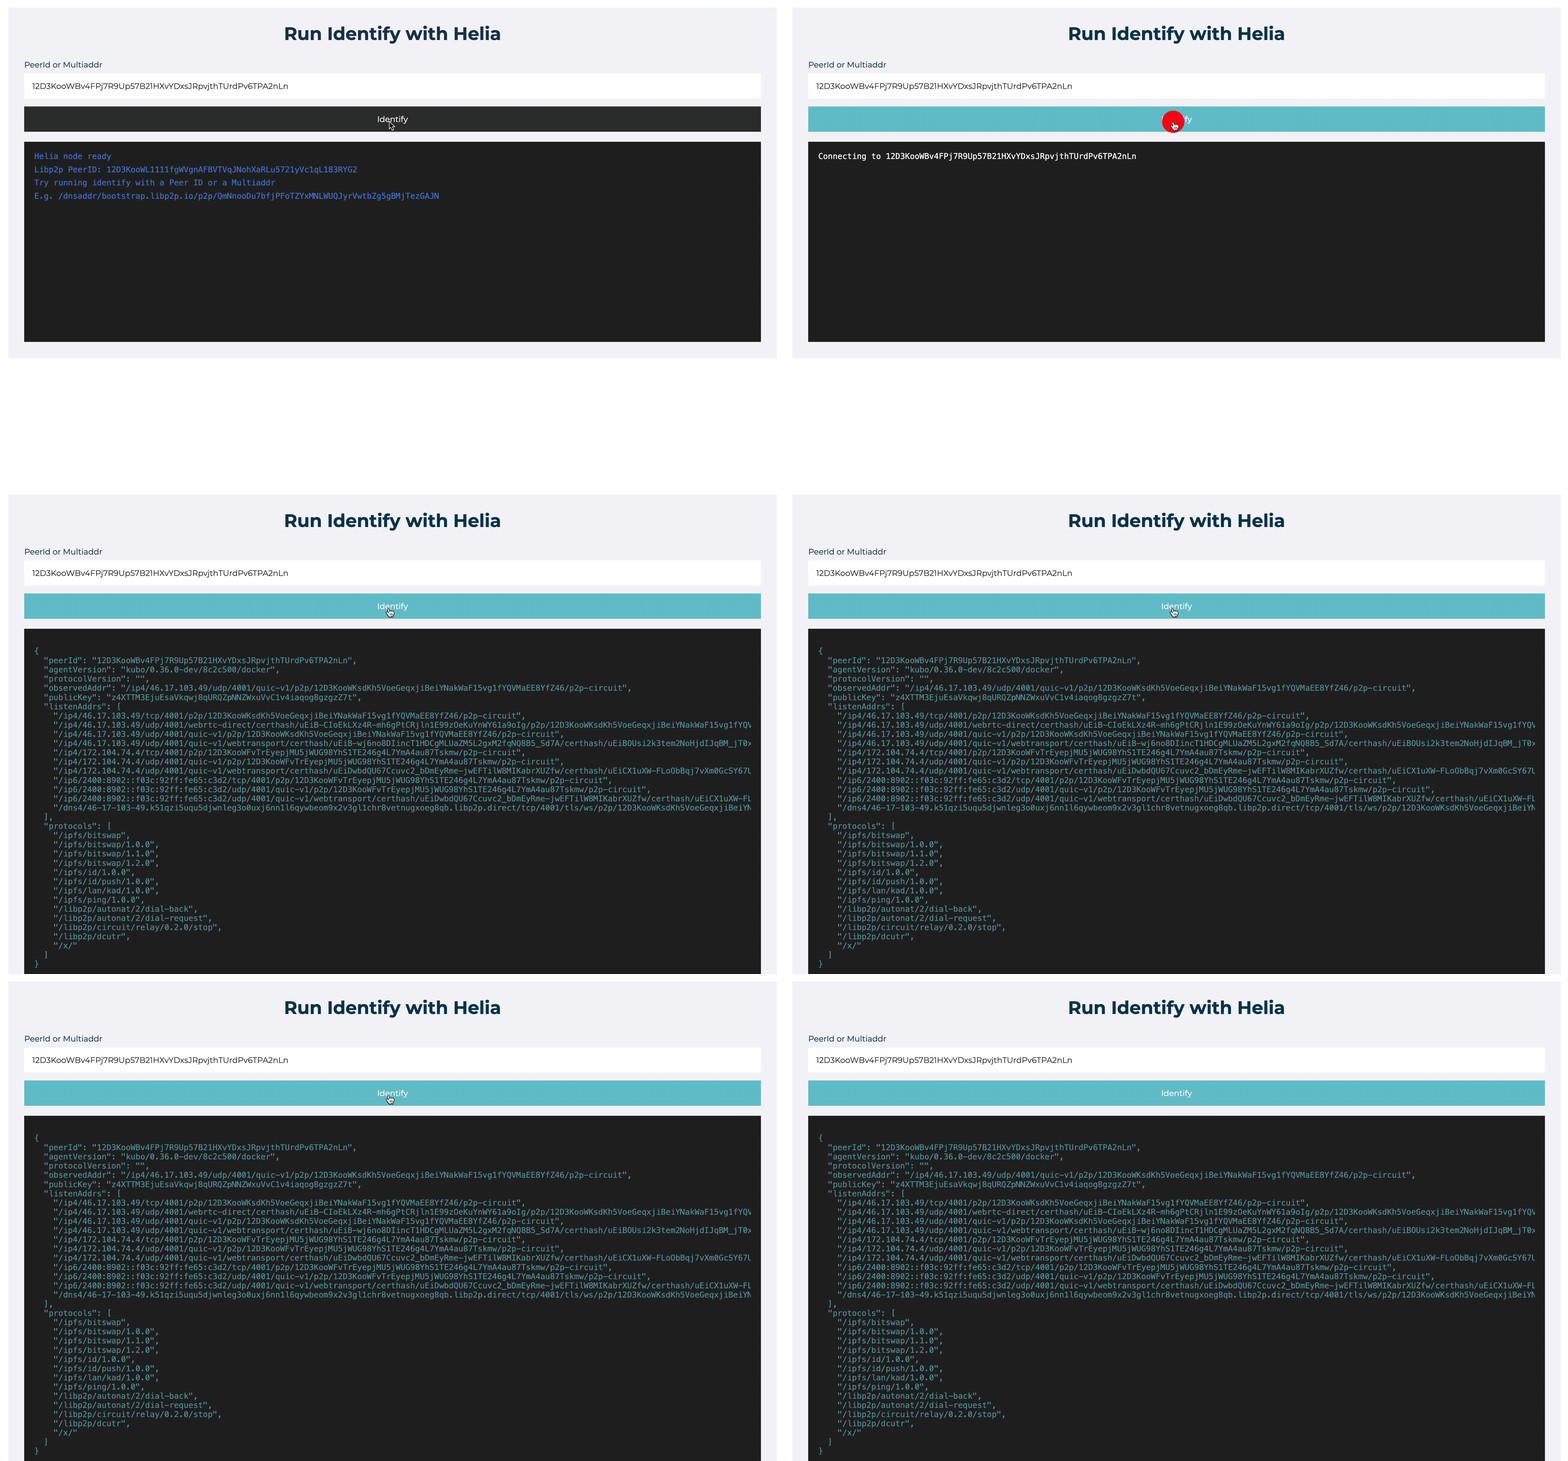
Helia Identify (opens new window) is a browser-based tool to run libp2p identify with a given peer id, testing whether the peer is dialable from a browser. This is useful to test whether a provider is reachable from a browser, which is a common cause of browser-based retrieval failures.
The following gif shows how to use Helia Identify to test whether a provider is reachable from a browser, by entering a Peer ID in the input field and clicking the Identify button.
# Troubleshooting retrieval with Kubo
This procedure assumes that you have the latest version of Kubo installed. To debug manually:
Open up a terminal window.
Using Kubo, determine if any peers are advertising the
<CID>you are requesting:ipfs routing findprovs <CID>If providers are found, their Peer IDs are returned. Example output:
12D3KooWSvjCTS6w6f6nyJQ615p4ipiW3L7BTbt9XvpR6Kxi385m
12D3KooWDCNa4MmDPHr3916gpk2PcQJbJXyKxfByTL6UBmSwBM2H
12D3KooWDEYGGZAH4v1Hu75nqyF4vnN8UyfgCCwerTD98F1Z8Q1z
12D3KooWHr9MZJVKwe7tZyD6Z8uRcZFQ7XUqhM2nQvpeQxDyAN4E
12D3KooWGLyBGRMdNQe5KnkeT2g3QYp7uM71tpn77somfRHaWmmS
In this case, complete the steps described in Providers returned.
If no providers were returned, the cause of your problem might be content publishing. Complete the steps described in No providers returned.
# Providers returned
If providers were found, do the following:
In the terminal, retrieve the network addresses of one of the peers returned using its
<peer-id>:ipfs id -f '<addrs>' <peer-id>Upon success, you'll see a list of addresses like:
/ip4/145.40.90.155/tcp/4001/p2p/12D3KooWSH5uLrYe7XSFpmnQj1NCsoiGeKSRCV7T5xijpX2Po2aT
/ip4/145.40.90.155/tcp/4002/ws/p2p/12D3KooWSH5uLrYe7XSFpmnQj1NCsoiGeKSRCV7T5xijpX2Po2aT
ip6/2604:1380:45e1:2700::d/tcp/4001/p2p/12D3KooWSH5uLrYe7XSFpmnQj1NCsoiGeKSRCV7T5xijpX2Po2aT
/ip6/2604:1380:45e1:2700::d/tcp/4002/ws/p2p/12D3KooWSH5uLrYe7XSFpmnQj1NCsoiGeKSRCV7T5xijpX2Po2aT
Try fetching the block:
ipfs block get <CID>If the block is successfully retrieved, you'll see the block data in the terminal.
# No providers returned
If no providers are could be found in the DHT or IPNI, it could be due to one of the following reasons:
- All providers for the CID are currently offline.
- The provider is having trouble announcing the CID to the DHT or IPNI.
- There is a problem with the content routing system (either the DHT or IPNI).
If that happens, check the IPNI website (opens new window) to rule out an issue with the IPNI.
Broadly speaking, the Amino DHT is resilient to outages, so it's less likely to be the cause of the issue. A more likely cause is that the provider is having trouble announcing the CID to the DHT.
If you are the provider for the CID, see the next section on troubleshooting providing.
If you rely on a pinning service to provide the content, check the status page of the pinning service.
If you are not the provider for the CID and cannot find any providers, there's not much more you can do. However, if you still have a copy of the content or can fetch it as a .car file from somewhere, you can provide it to the network by importing it into Kubo with ipfs dag import <file>.car.
# Troubleshooting providing
In this section, you will learn to troubleshoot common issues with providing. For a more detailed overview of the providing process, see the lifecycle of data in IPFS.
If clients are unable to find providers for a CID, the issue may lie in the content providing lifecycle, specifically reprovider runs, the continuous process in which a node advertises provider records. Provider records are mappings of CIDs to network addresses, and have an expiration time of 48 hours, which accounts for provider churn.
Generally speaking, as more files are added to an IPFS node, the longer reprovide runs take. When a reprovide run takes longer than 48 hours (the expiration time for provider records), CIDs will no longer be discoverable.
# Troubleshooting providing with Kubo
With this in mind, if no providers are returned, do the following:
First, determine how long a reprovide run takes:
ipfs stats reprovideThe output should look something like this:
TotalReprovides:       4k (4,140)
AvgReprovideDuration:  12.870309s
LastReprovideDuration: 44m32.507618s
LastReprovide:         2025-06-10 09:45:18
Note the value for
LastReprovideDuration. If it is close to 48 hours, or if you notice a "reprovide taking too long" warning in youripfs daemonoutput log, select one of the following options, keeping in mind that each has tradeoffs:Enable the Accelerated DHT Client (opens new window) in Kubo. This configuration improves content providing times significantly by maintaining more connections to peers and a larger routing table and batching advertising of provider records. However, this performance boost comes at the cost of increased resource consumption, most notably network connections to other peers, and can lead to degraded network performance in home networks.
Change the Reprovider Strategy (opens new window) from
allto eitherpinned+mfsorroots. In both cases, only provider records for explicitly pinned content are advertised. Differences and tradeoffs are noted below:- The
pinned+mfsstrategy will advertise both the root CIDs and child block CIDs (the entire DAG) of explicitly pinned content and the locally available part of MFS. - The
rootsstrategy will only advertise the root CIDs of pinned content, reducing the total number of provides in each run. This strategy is the most efficient, but should be done with caution, as it will limit discoverability only to root CIDs. In other words, if you are adding folders of files to an IPFS node, only the CID for the pinned folder will be advertised. All the blocks will still be retrievable with Bitswap once a connection to the node is established.
- The
Manually trigger a reprovide run:
ipfs routing reprovide
